Graph Databases in 2D
A graph database is built of the aggregate of all one-to-one pairings--edges--of individual elements--nodes--in a data set. These individual nodes can represent any form of data. For example, a node could be an individual or business that is involved in a criminal enterprise. By modeling each pairing (person-to-person, person-to-business), the structure of the enterprise is revealed. You see this in law enforcement dramatizations where the purported head of a criminal organization is placed at the center of a large wall surface, and yarn is used with pushpins to connect that person to their associates and to their affiliated businesses. In data analytics the members of the criminal enterprise are nodes and the yarn connections are the edges.
Clustering the Data - Telling a Story
Edge pairings between nodes can be based on different parameters. In our criminal enterprise example, some nodes (criminals or businesses) may be connected by a certain type of business such as illegal drugs, and others by illegal weapons. Some may be political connections; others financial. These edge connections may be further characterized by parameters that indicate the significance of the edge, such as volume of business or frequency of interaction. Analysis of these edges can reveal clusters, weighting certain associations greater than others, and thereby uncovering more insight into the data than simple one-to-one pairings. Nodes with more commonality cluster together. The data begin to tell a story, even to reveal multiple narratives.
Force-Directed Graphs
Force-directed graphs are a way of visualizing these data clusters. Nodes with commonality are drawn to each other; nodes without commonality push each other away. The force-direction can be applied by many different algorithms, resulting in different clustering results.
Graph Databases in VR: Neo4j and Unity
Neo4j is the premier graph database in commerce and academia today. AviarGraph is built using the industry-leading VR game engine Unity. AviarGraph ingests Neo4j datasets in JSON format by leveraging the Neo4j .NET driver for connecting to Neo4j 4.0.0+ databases via the Neo4j in-house binary protocol Bolt in order to call APOC procedures. The node and relationship dataset retrieved is then iterated to render nodes and relationships in a dynamic, immersive and interactive 3D VR environment.
Unity's physics engine is used to implement force-directed graph behavior whereby nodes with relationships draw to each other and nodes lacking relationships push each other away. With this unsupervised machine learning process, the graph reaches a state of equilibrium and reveals the topology of the data. The same dataset organizes itself the same way every time. The analyst in the VR environment can then explore the data topology free from the constraints of small 2D flat screen monitors.
Presently AviarGraph includes the following features (more to come):
- Nodes are color-coded by node type.
- Relationships are color-coded by relationship label.
- Multiple relationships between two nodes render as Bezier curves so all are visible.
- Relationship directionality is indicated by chevrons and dynamically by link scrolling
- Weighted-edge graphs are supported.
- Higher weighted relationships (edges) scroll faster than lower weighted relationships
- Higher weighted relationships (edges) are colored more brightly.
- The relationship must possess a property named "weight", which must be a non-negative integer.
- Centrality is revealed by the force-directed graph functionality.
- Nodes with more relationships move to the center of the graph.
- Nodes with fewer relationships are pushed to the perimeter.
- In Dynamic Nodes mode, moving nodes with higher centrality exerts more influence on the rest of the graph.
- Isolate nodes (nodes with no relationships) float outside the main graph
AviarGraph enables an analyst to interact with the graph. Using the hand controller menus, analysts can
- Down-select relationships thereby reconfiguring the graph
- Examine properties of nodes and relationships
- Pin specific nodes for focus, while the remaining nodes continue to adjust their positions
- Make all nodes stationary
- Hide isolate (disconnected) nodes
- Nodes may become disconnected by a given down-select among the various relationships
- Move around to various locations within the graph by means of VR teleportation
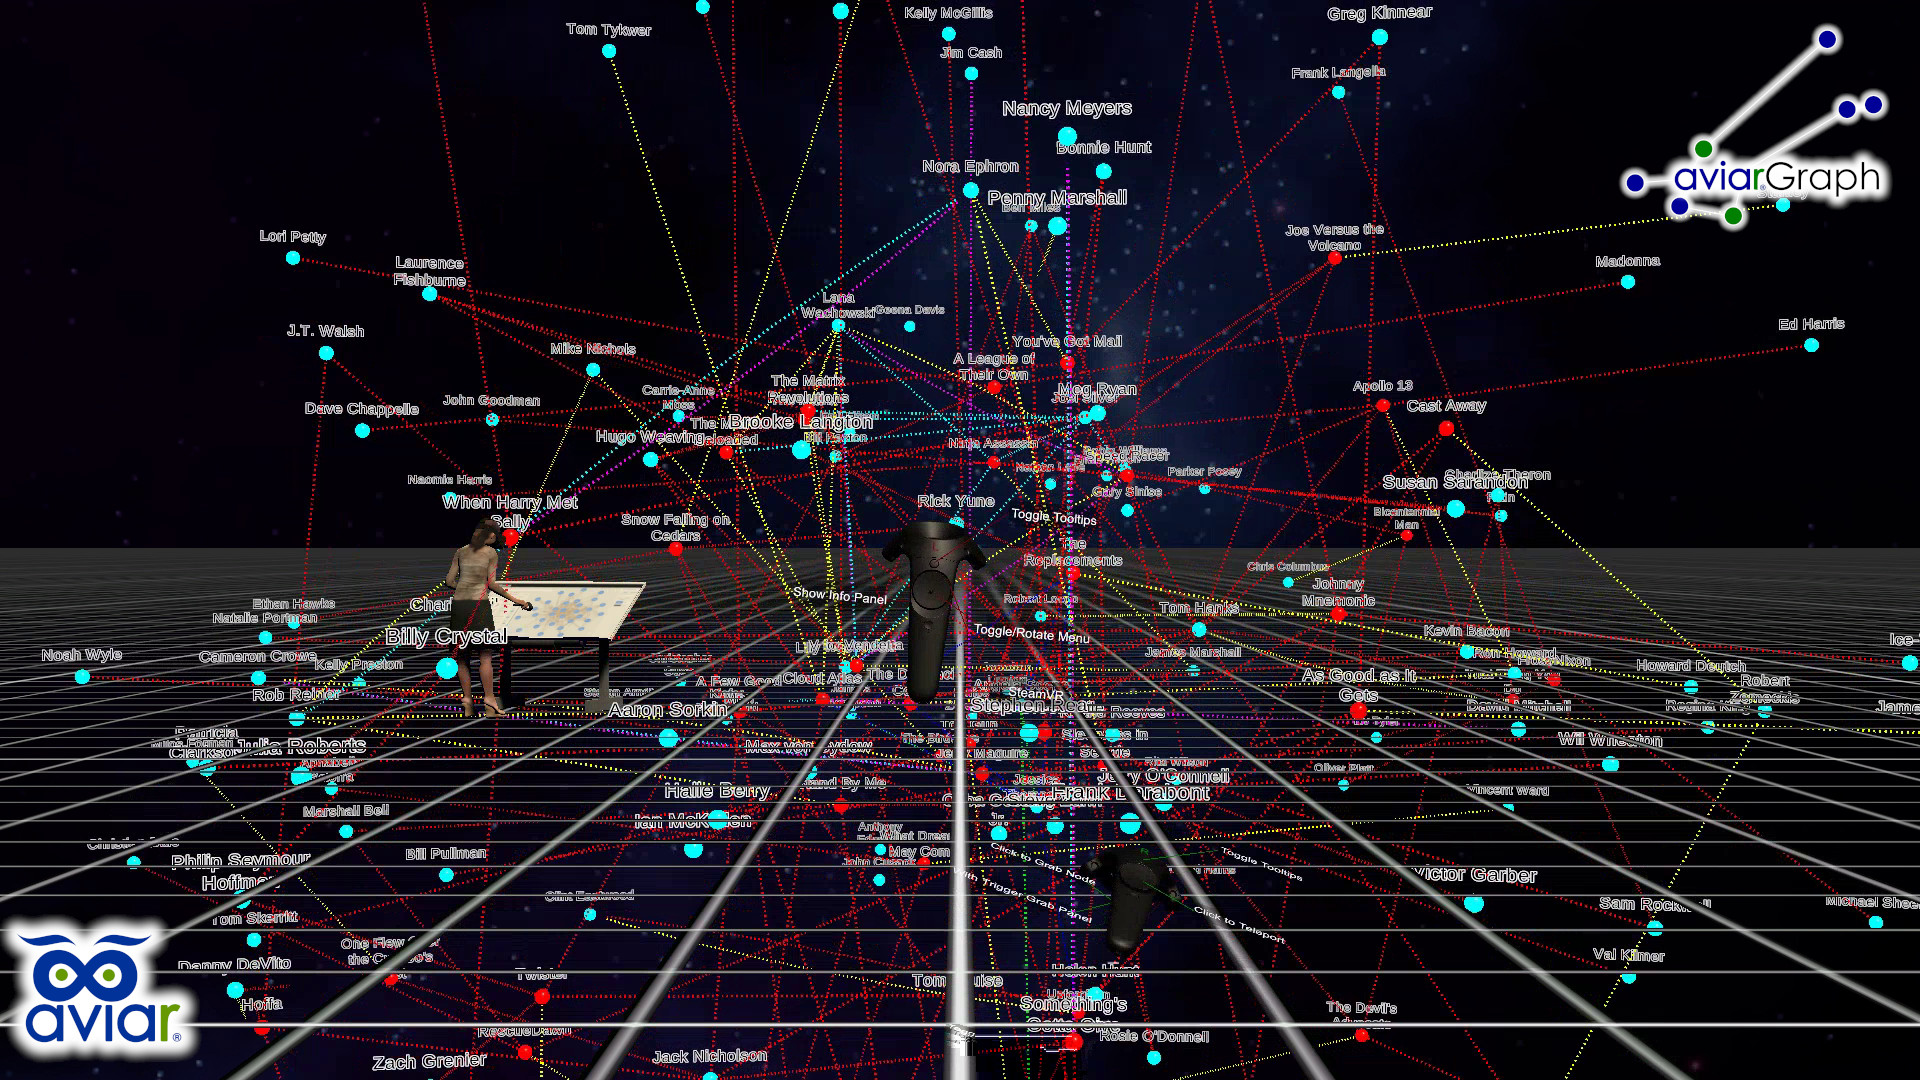
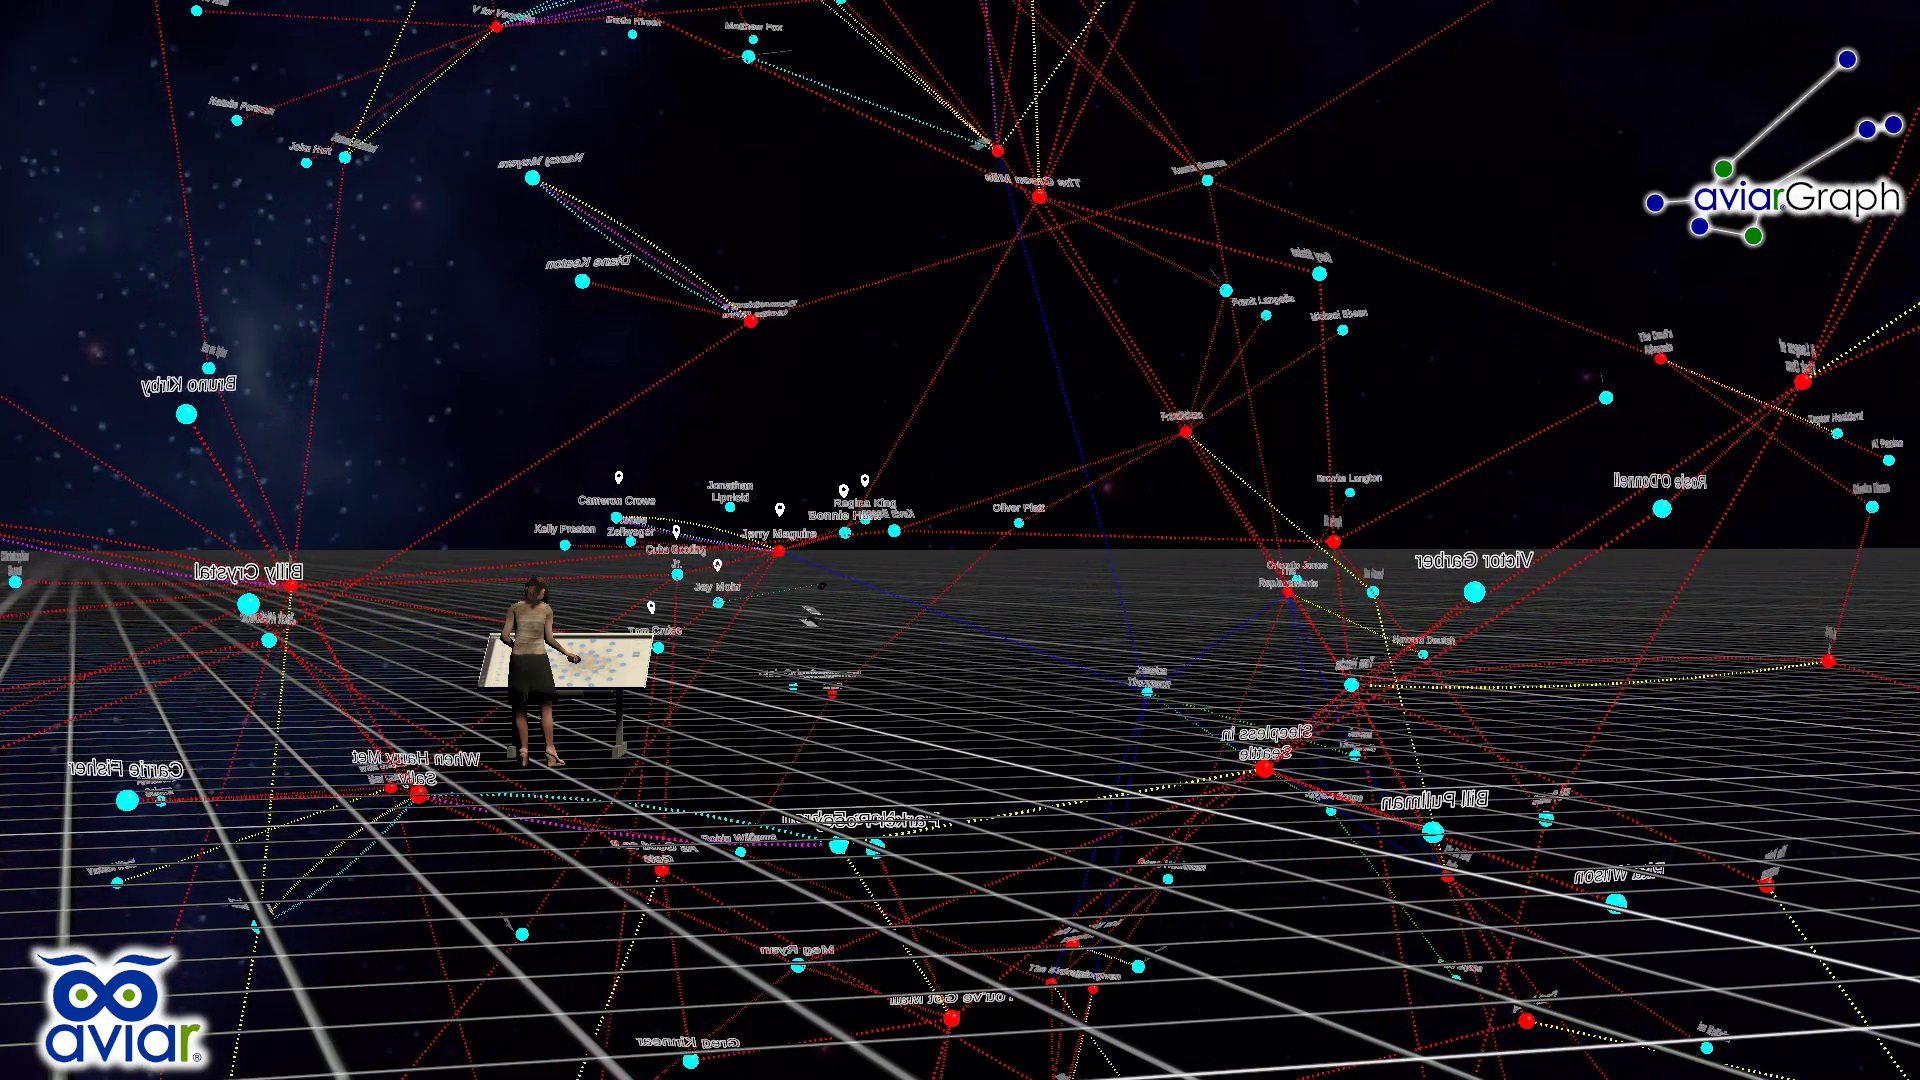
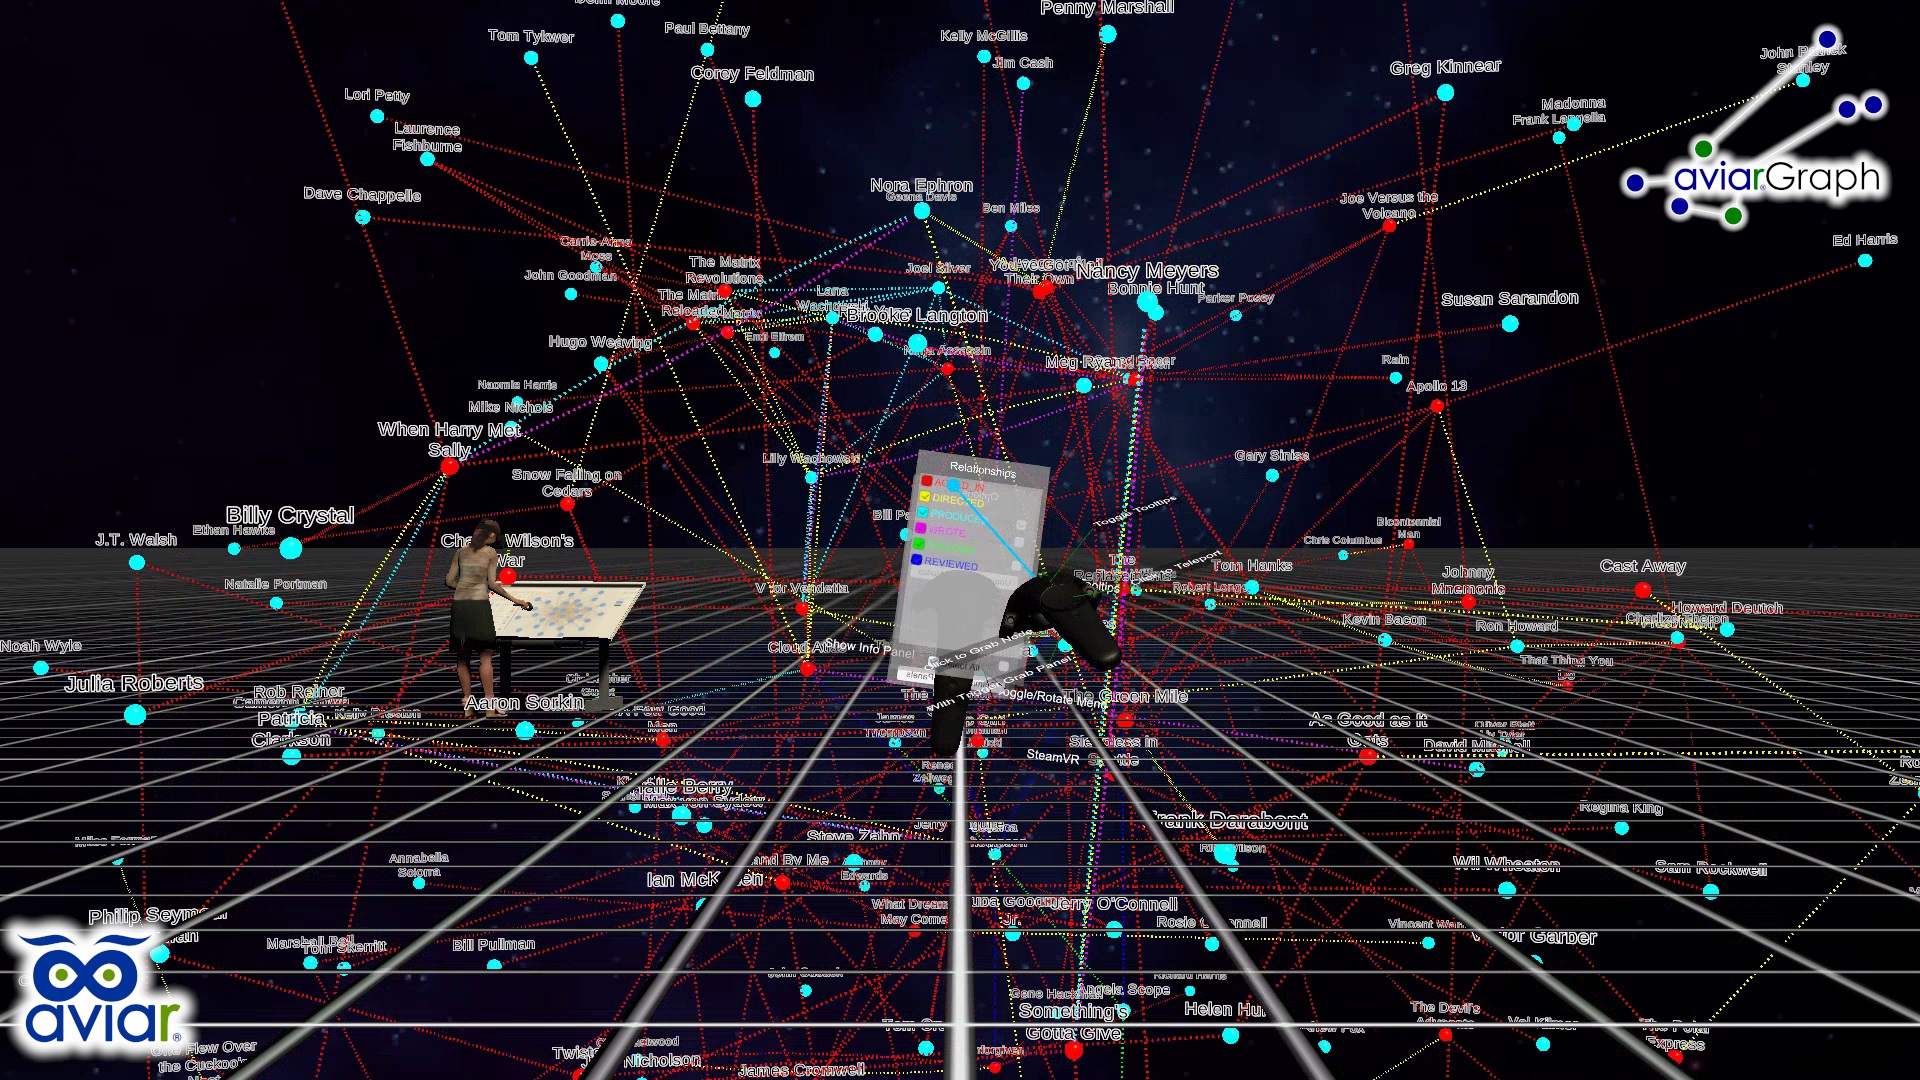
Following are some screen captures of AviarGraph in action. This demonstration ingests the Movie graph database from the Neo4j Sandbox via the Bolt protocol. The table and person in the scene gives a sense of the visualization's scale to a user in VR.
In this graph database visualization, Person nodes are light blue and Movie nodes are red. Relationships are colored thusly:
- ACTED_IN
- DIRECTED
- PRODUCED
- WROTE
- FOLLOWS
- REVIEWED
With AviarGraph you go from this:
 | or this |  |
to this (click for video):
An alternate view of AviarGraph from a stationary perspective (click for video):
Following are snapshots of AviarGraph in action.
Here the graph has deployed. The force-direction effect quickly reveals the data topology. Nodes with a higher degree of centrality (nodes having more relationships to other nodes) move immediately to the middle, while nodes with fewer relationships drift to the perimeter. The analyst is about to down-select among the various relationships in the graph by unchecking a relationship from the menu.
![]()
Here the analyst has filtered out ACTED_IN relationships, removing them from the graph. Nodes connected only by ACTED_IN relationships start to drift and the graph quickly fragments. This illustrates the significance of this relationship.

Here the analyst has teleported in closely to the movie Jerry Mcguire and has started to pin particular connected nodes. Pinned nodes display the familiar map pin icon and remain fixed in the 3D space. Unpinned nodes continue to move about under the effect of the force-direction action.

The analyst now examines properties of the various nodes. All properties contained in the Neo4j graph show on a scrollable panel. (In this graph Person nodes have two properties while Movie nodes have three.)

Here the analyst has moved closer to inspect the relationships between the Person node "Cameron Crowe" and the Movie node "Jerry Mcguire". Cameron Crowe has three relationships with Jerry Mcguire, "DIRECTED" (yellow), "PRODUCED" (light blue), and "WROTE" (magenta). The relationship lines are Bezier curves making them easy to distinguish. Since there are three, the lines are 120° apart. The chevrons in the relationship lines indicate the relationship directionality, in this case from the Person node to the Movie node. If the graph database contains other properties for a given relationship they are listed on the panel.

To learn more about AviarGraph, contact James Mireles at James.Mireles@Aviar.tech today!
© Copyright 2021, James R. Mireles